In the last post, I flagged up the fact that no heat meters will be fitted to homes on heat networks under the Energy Efficiency Directive. This is because, no matter what inputs you feed into DECC’s calculation tool, the output is always the same: heat meters aren’t viable.
As a result, around 300k homes with unmetered connections will continue to pay a flat fee regardless of how much heat they use, robbing them of control over spending and giving them no incentive to save.
In this post, I’ll show that heat meters are viable in a typical block of flats. I’ll also show how a single unrealistic assumption in the DECC calculation tool pretty much guarantees that the computer says no, every time.
The calculation tool necessarily includes several assumptions. Some of these are debatable, like the 9% discount rate for net present value calculations (are these network operators buying heat meters on a credit card?!). While tinkering with most of the assumptions might nudge NPV up or down, the single most important variable is heat network efficiency, which has a massive impact on viability.
Unfortunately, DECC’s calculation tool includes two incorrect assumptions regarding network efficiency.
First, it assumes that networks are 90% efficient, citing an as yet unpublished heat networks study. I’ve never seen a network achieve this efficiency. The most efficient network I’ve come across (and only on paper, not in person) is Sønderby, with an efficiency of 87%. But that’s cutting edge Danish 4GDH. In the UK, most of the unmonitored networks that I’ve looked at have an efficiency of 30% or less!
Second, it assumes that the network efficiency will remain unchanged after meter install. This touches on one of the key benefits of the EED: in principle it forces network operators to recognise poor efficiency and do something about it. Meter data shows operators and residents exactly how much of their money is being lost as wastage. Where that wastage is sufficiently high, network operators will be forced to act or face a revolt by residents.
As soon as you correct these two assumptions, something interesting happens in the viability calculation.
To illustrate this, I’ve souped up DECC’s calculation tool to generate some sensitivity graphs. In the “user interface” tab, I’ve plugged in the details for a 100-home block of flats spread over 10 floors, built in the Midlands between 1960 and 1975. The only thing I’ve varied in the standard assumptions is the starting and ending efficiencies. Everything else is unchanged.
The resulting graphs can be tricky to interpret so let’s take a minute to talk through an example.
The aim of the graphs is to show the NPV of a meter installation according to the efficiency of the network before and after install. In the example below, we’re taking a network that’s 40% efficient before meters are installed (that’s what the purple “40% ” label at the start of the curve denotes). We’re then plotting out a curve, with each of the dots showing us the NPV of the meter install according to the efficiency of the network after meter install.
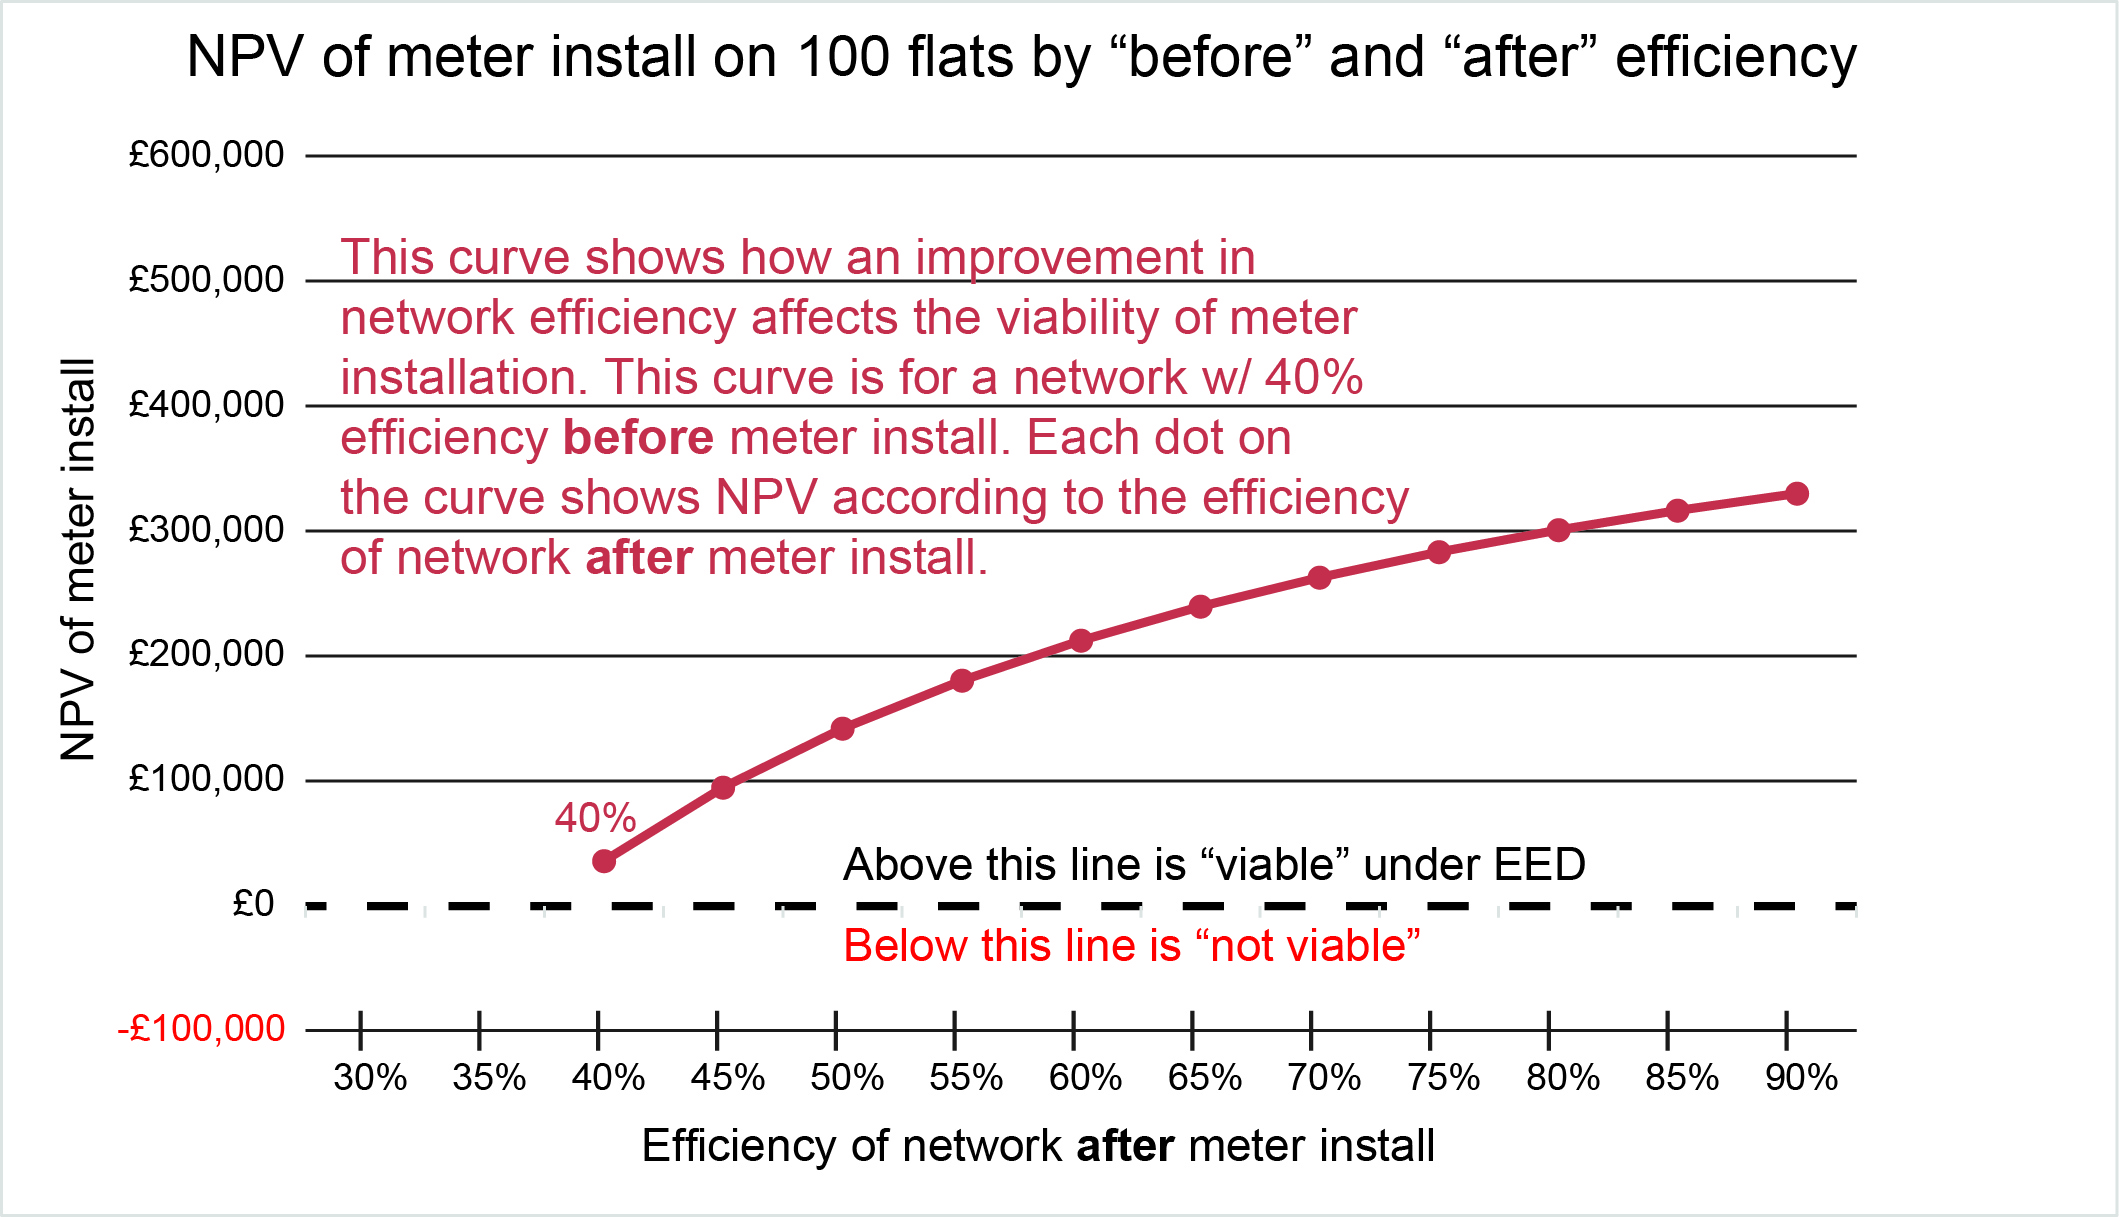
So the network shown in this graph starts off at 40%. The left-most dot is directly above the black “40%” label on the X axis. This means that the efficiency after meter install is also 40%. The dot corresponds to an NPV (on the Y axis) of about £36k.
It’s important to keep in mind that any dots that fall above the dotted line represent a positive NPV and so the meter install is considered viable. Anything below the dotted line has a negative NPV and so isn’t viable under the EED.
The next dot to the right is directly above the black “45%” label on the X axis. This means the network had an efficiency of 40% before meter install and then improves to 45% after install. This corresponds to an NPV of about £95k. All the other dots can be interpreted in a similar way.
Looking further right, if the network improves from 40% efficiency before to 80% after, it’s worth more than £300k! Compare that with the cost of installing the meters in the first place (£36k) and it illustrates just how much value is at stake here. Put another way, in this scenario the meter install and subsequent efficiency boost are worth more than £3,000 to each flat on our 100-home scheme.
So that’s how to interpret the graph. Let’s look at curves for a range of starting efficiencies:

There are a few key features to note. First, several of the networks are NPV positive even if there’s no improvement in efficiency after meter install. This is the case for the networks with efficiencies of 30%, 40% and 50%. The network with 60% starting efficiency is right on the line. In other words, DECC’s calculation tool says meter installations on these networks are viable without taking any efficiency improvement into consideration.
The second feature to note is, for networks with a higher starting efficiency, even a modest improvement after meter install is enough to result in a positive NPV (and so a viable meter install). For example, for a network that starts out 70% efficient, improving the efficiency by another 5% is enough to move it above the dotted line.
And now take a look at that dark blue dot representing a network that starts (and finishes) at 90% efficiency. This is the DECC assumption, which is built into the calculation tool. It’s hanging there, well below the dotted line:
 First, it’s not realistic. There’s just no way that an unmonitored UK network is going to achieve anything like 90% efficiency.
Second, making this assumption ensures that a meter installation has no chance of viability. This is because the extremely high efficiency results in an underestimation of the value of the energy savings (remember the people in the flats will consume less after meter install because they’ll pay only for what they use).
It’s worth pointing out that these results are for the “typical” scheme I describe above (100 flats in the Midlands, etc.). Every scheme will be different. Nevertheless, it should be clear that the effect of efficiency assumptions on NPV is so enormous it can very quickly catapult schemes into viability.
To finish off, I want to emphasise how important it is that we get this right. By definition, we don’t know the efficiency of the 75% of networks that are unmetered. That’s around 300k homes using DECC’s latest figures.
Imagine those networks are operating at 40% efficiency and installing meters allows the operator to nudge this up by just 5%. That’s worth £300m across the fleet! Maybe I’m being a little simplistic here, but you get the picture.
The same value would result if all those networks were operating at 50% efficiency and the operators increased to 65%. Or from 60% to 85%. The potential value is enormous but it’s not accessible without heat meters.
Unless DECC use more realistic assumptions in their calculation tool, we won’t retrofit these heat meters. As a result residents on inefficient networks will continue to pay too much and the Energy Efficiency Directive will deliver no such thing.

Interesting to see that the 90% system efficiency is from an “unpublished” DECC study. I’d love to see this document but I reckon it’s locked up in a warehouse somewhere in the Nevada…
Thanks for running the all-important sensitivity analysis Casey.
Fortunately no professional will ever use the DECC tool to evaluate the viability of heat meters in its current form: Why?
Basing advice on an assumption – 90% network efficiency – which every professional engineer knows full well is wrong* is gross negligence. Referencing an unpublished and wholly unverifiable source doesn’t let you off the hook either. Compared with the losses that the general public or social landlords would incur as a result of your negligent advice, £5m of public liability/professional indemnity cover might not be enough to save you or your firm…
No faults with the math in the DECC tool’s math otherwise though? Once the reference for the 90% figure is published, torn apart, and revised it’ll be a helpful tool.
My suspicion: This 90% network efficiency figure was probably the right answer to the wrong question; all thanks to ambiguity of system boundary.
Say an economist at DECC asked how efficient heat networks were, without realising how important it was to specify the system boundary/metering point. A big consultancy who only knows primary distribution systems won the tender, so they gave the answer (90%) for primary distribution only; the MW scale heat networks that bring heat from a remote plant to the boundary of a site. DECC wouldn’t been given the answer (50-75% if being generous?) they should have used which includes secondary distribution losses within the site; the kW scale heat networks that bring heat to a consumer’s home.
An unwillingness on the part of M&E consultants to draw attention to the efficiency of their kW scale distribution systems doesn’t help matters. Those pushing back against the draft Heat Networks Code of Practice a document aiming to improve design of the all important kW scale networks *definitely* aren’t helping. Shame the responses to the initial round weren’t public. Perhaps we could make it so for the second consultation? Along with it being mandatory to at least estimate your losses as a heat network operator, given how vital it is to consumer pricing?
*it is easy to calculate from first principles to a level of accuracy good enough to disprove the assumption; something which every professional engineer will always do.
Thanks for sharing this analysis Casey. Does anyone know how this is being implemented in other EU countries? It could be interesting to see if similar schemes would end up being treated very differently in different member states or not.